.webp)
.svg)
With only a property name, our system helps you benchmark operations to similar properties and underwrite multifamily investments anywhere in the country in a matter of seconds.
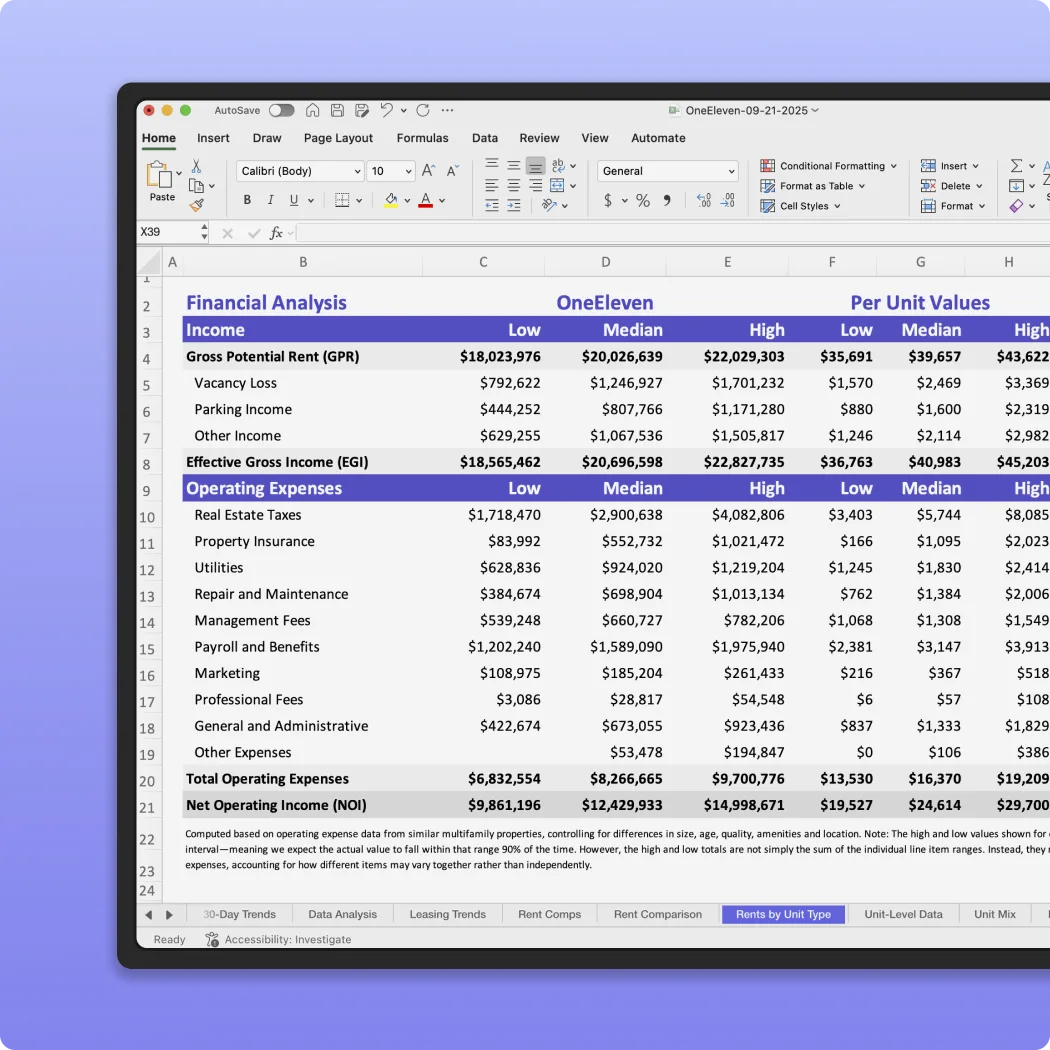
We offer detailed Excel exports and flexible APIs to pull in rent comps, expense benchmarks and detailed unit-level rent and availability data right where you work.
Whether you want to pull our data into your underwriting models or integrate our APIs with Salesforce and PowerBI, we can help.
Our financial benchmarks are backed by historical operating data from thousands of properties across the U.S. and a proprietary approach we developed to derive NOI and generate synthetic operating expense data.
Learn more about our data →
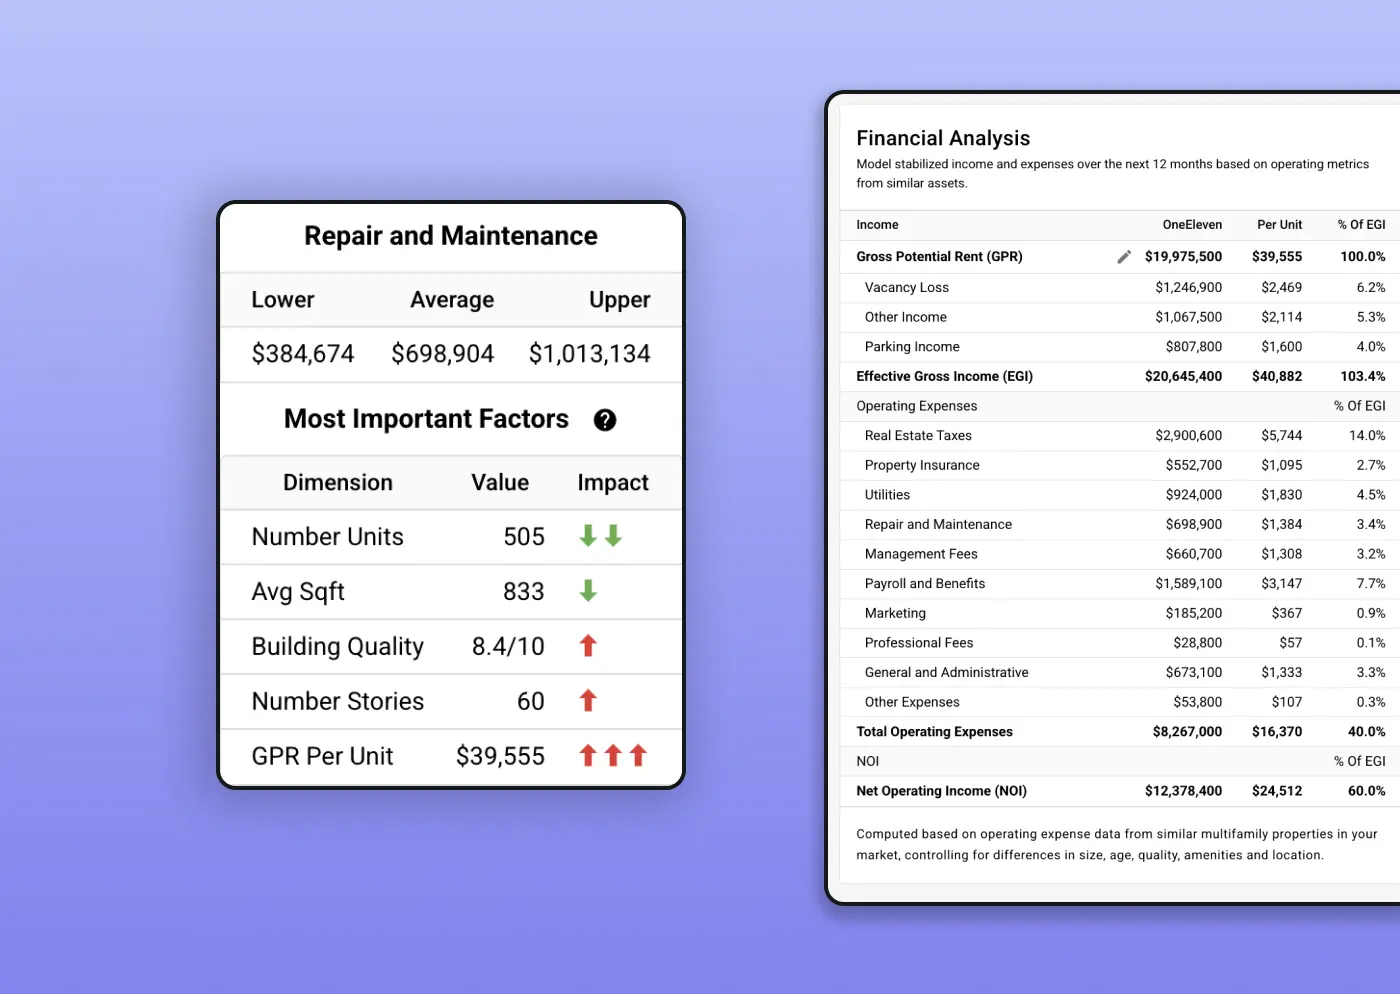
Make informed decisions with our detailed financial analysis. We provide a clear breakdown of potential expenses for any multifamily property, modeled on data from thousands of similar assets.
Understand the key factors that drive costs and see where your property falls on the spectrum from lower to upper range.
